
by Robert Fry, chief economist
Robert Fry Economics LLC
The S&P 500 stock price index has declined 14.5% since its record close on September 20, 2018. While the financial press focuses on the stock-price decline itself, economic forecasters like me are more concerned about what the decline means for real (non-financial) economic activity. The stock-price decline could reflect a slowing in US economic growth that is already underway. It could signal or even contribute to a coming slowdown. It could reflect or signal a slowdown in earnings growth due to something other than a slowdown in US economic growth. Or it could simply reflect a change in stock-market valuations due to higher interest rates or increased risk aversion (and a larger equity risk premium).
Residential construction has declined, and business investment has stagnated, but most of the US economy continues to grow. Retail sales excluding food, autos, gasoline and building materials – the “control group” used to calculate consumer spending in Gross Domestic Product – rose 0.8% in November 2018, the biggest increase of the year, and October sales last year were revised up. The Federal Reserve Bank of Atlanta has reacted to the reported strength in retail sales and implied strength in consumer spending by boosting its GDPNow estimate for Q4 2018 GDP growth to 2.9%.
That’s a lot of cars
While analysts and auto companies have been talking about declining vehicle sales, light vehicle sales have surprised on the high side for three straight months, coming in above a 17-million seasonally adjusted annual rate. Sales for 2018 will come in about Reconciling the Stock Market with the Real US Economy in 2019 by Robert Fry, chief economist of Robert Fry Economics LLC where they were in 2017 and will exceed 17 million for a fourth straight year, something that has never happened before. Reports of declining vehicle sales are exaggerated and/or premature.
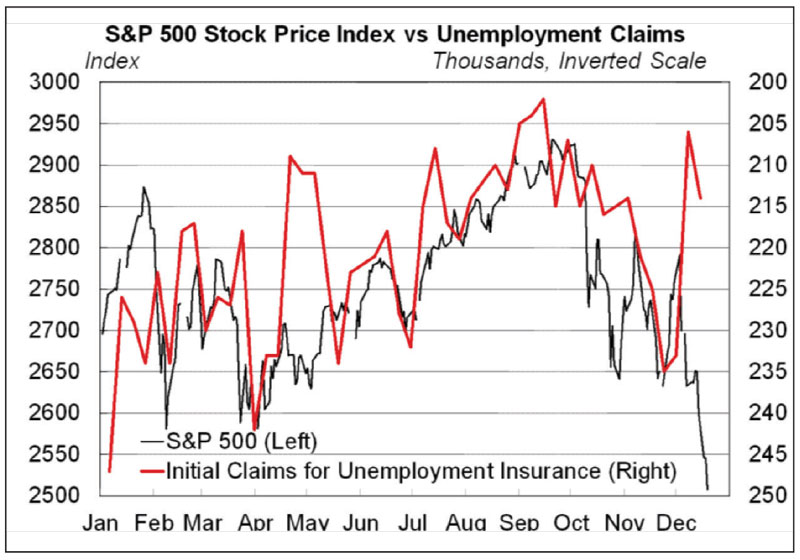
New claims for unemployment insurance, the best weekly measure of economic activity, seemed to be signaling a slowdown when they spiked in late November, but they’ve since fallen back toward cyclical lows, suggesting that the spike might have been due to difficulties in seasonally adjusting data around the (early) Thanksgiving holiday (see line graph at left). Less positively, industrial production in US manufacturing was flat in November, and October’s 0.2% gain was revised down to a 0.1% decline. However, a big increase in the Institute of Supply Management’s manufacturing index (and, specifically, in the New Orders component of the index) suggests that most US manufacturers continue to grow.
More serious slowdown ahead?
Even though the American economy has slowed only slightly so far, the stock market could be signaling a more serious slowdown ahead. The stock market sometimes sends false signals – hence Paul Samuelson’s quip that it has predicted “nine of the last five recessions” – but it still is a useful leading indicator that should not be ignored.
Stock prices could be forecasting that growth will slow in response to interest-rate hikes (past or future) and/or tariffs. Stock prices turned down after hawkish comments by Federal Reserve Chairman Jerome Powell on Oct. 3, 2018, and fell sharply when the Fed raised its federal funds rate target on Dec. 19 and suggested it would raise rates further in 2019. Prices have repeatedly fallen/risen on bad/good trade news. Regardless of the reason (or lack thereof), a stock-market decline can cause economic growth to slow by reducing consumer spending and business investment.
Declines abroad reflected here
I believe the decline in stock prices primarily reflects slower growth in corporate earnings resulting from slower economic growth outside the United States. S&P 500 companies get almost half of their earnings from outside the United States. Economic growth outside the United States had been slowing all of last year.
Real GDP declined in Japan, Germany and Italy in Q3 2018. While purchasing managers’ indices and auto sales remain solid in the United States, both have plummeted in Europe. Perhaps more concerning is the ongoing slowdown in China and the realization that US companies will never make as much money in China as they thought they would. (Some of us realized that two decades ago.) China reported on Dec. 14 that year-over-year growth in retail sales slowed in November to its slowest rate since 2003. Growth in industrial production, at 5.4%, matched its slowest year-over-year growth rate since 2009. (Excluding January/February data, which are distorted by the variable timing of the Lunar New Year, growth in industrial production matched its slowest rate since the data series began way back in 1995.) Despite an announcement that China would reduce tariffs on US motor vehicles and the better-than-expected report on American retail sales, US stock prices fell sharply in response to the weak Chinese data on December 14, 2018.
Brexit and tariffs and oil. Oh, my!
Growth in Europe has been hurt by concerns about the United Kingdom’s “Brexit” from the European Union this March and by the new Italian government’s rejection of fiscal discipline. The slowdown in China reflects a shrinking working-age population (the result of the single-child policy), excessive government debt (the result of repeated fiscal stimulus) and slower growth in exports because of slowing in the rest of the world. US tariffs have had little impact … so far.
But, perhaps the biggest reason for the slowdown in global growth is the increase in oil prices. The average monthly price of Brent Blend crude oil rose from $46.37/barrel in June 2017 to $81.03 in October 2018. For many developing countries, whose currencies have depreciated vs. the dollar, local-currency prices rose even more. Because of higher domestic oil production, high oil prices don’t hurt the American economy as much as they used to, but they hit oil-importing countries with little or no domestic production very hard. The sharp decline in oil prices since Oct. 4 will hurt oil producers, including those in the United States, but will provide some relief to most economies in the world.
Fewer interest-rate hikes likely
US infl ation already was declining before oil prices peaked. It will fall further in coming months. This will allow the Fed to slow (or halt) interest-rate hikes until inflationary pressures build again. At its September 2018 meeting, the Federal Open Market Committee’s median projection was for three quarter-point hikes in the federal funds rate this year. FOMC members now expect two rate hikes. (I also expected three; I now expect just one.) As the forecasted number of rate hikes has declined, so have long-term bond yields and mortgage rates. This should help end the recent decline in home sales and housing starts.
Despite the lower expected trajectory for oil prices and interest rates, I’ve lowered my forecast for US real-GDP growth forecast to 2% in the first half of 2019 in part because of the damage done by lower stock prices but mostly because of the continuing threat to the economy from tariffs. My forecast assumes US tariffs on Chinese goods either rise to 25% for only a few months or remain at 10% indefinitely. If tariffs go to 25% and stay there, growth will fall below 2% and the risk of a recession will rise. If a successful trade deal is reached and the 10% tariffs are removed, growth will stay near 3% through 2019, especially if businesses respond to trade policy certainty, tax reform and tight labor markets with productivity-enhancing investments in plants, equipment and software.
From the December 2018 issue of Current Economic Conditions. Copyright© 2018 Robert Fry Economics LLC. Reprinted with permission.
Robert Fry is chief economist of Robert Fry Economics LLC. To subscribe to Current Economic Conditions and receive every monthly issue as soon as it is published, contact robertfryeconomics@gmail.com.